Hello World
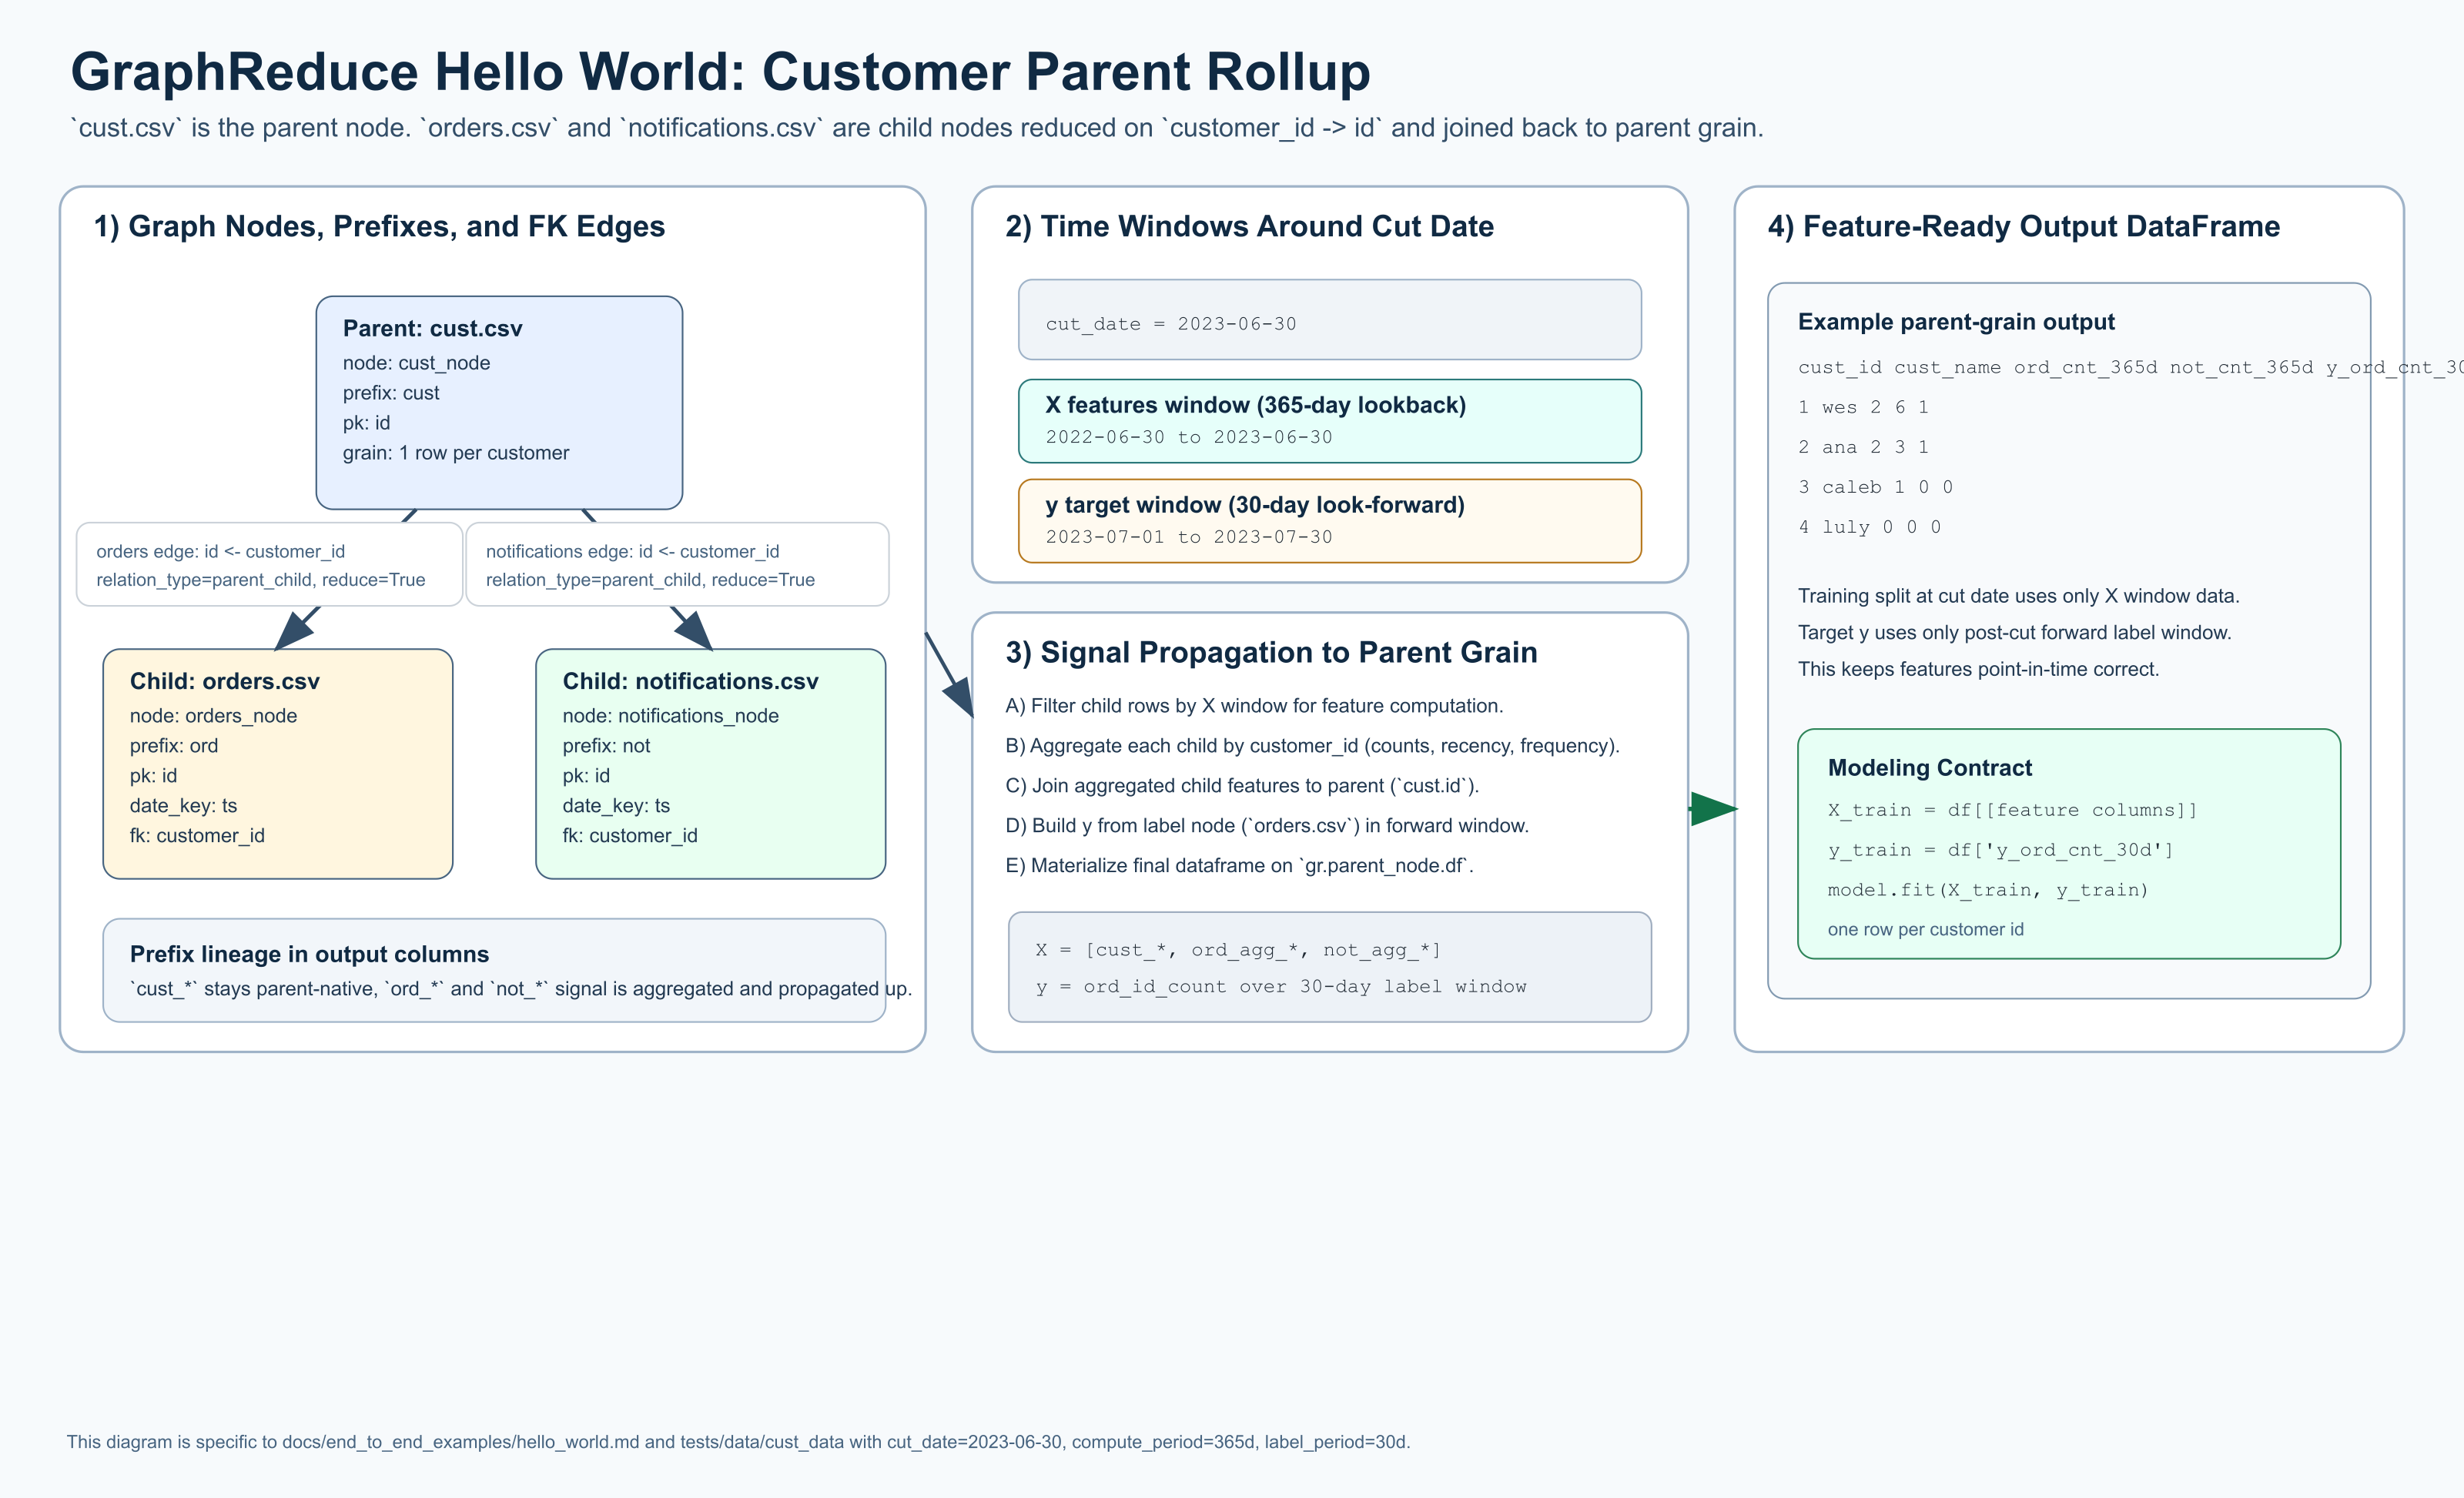
The diagram above shows the exact graph shape and time handling for this example:
cust.csv as parent, orders.csv and notifications.csv as children, 365-day
lookback features (X), and a 30-day forward label window (y).
This example is a minimal end-to-end GraphReduce workflow using the same sample
files used in tests/test_graph_reduce.py, specifically from
tests/data/cust_data/*.
It mirrors the test_multi_node_customer flow:
- parent table:
cust.csv - relation tables:
orders.csv,notifications.csv - automated feature generation enabled
- automated label generation enabled
Prerequisites
Run from the repository root so tests/data/cust_data resolves correctly.
Install GraphReduce core (no backend extras needed for this example):
Complete Example
import datetime
from pathlib import Path

from graphreduce.node import DynamicNode
from graphreduce.graph_reduce import GraphReduce
from graphreduce.enum import ComputeLayerEnum, PeriodUnit

data_path = Path("tests/data/cust_data")

cust_node = DynamicNode(
    fpath=str(data_path / "cust.csv"),
    fmt="csv",
    prefix="cust",
    date_key=None,
    pk="id",
)

orders_node = DynamicNode(
    fpath=str(data_path / "orders.csv"),
    fmt="csv",
    prefix="ord",
    date_key="ts",
    pk="id",
)

notifications_node = DynamicNode(
    fpath=str(data_path / "notifications.csv"),
    fmt="csv",
    prefix="not",
    date_key="ts",
    pk="id",
)

gr = GraphReduce(
    name="hello_world",
    parent_node=cust_node,
    fmt="csv",
    compute_layer=ComputeLayerEnum.pandas,
    auto_features=True,
    auto_labels=True,
    cut_date=datetime.datetime(2023, 6, 30),
    compute_period_unit=PeriodUnit.day,
    compute_period_val=365,
    label_node=orders_node,
    label_field="id",
    label_operation="count",
    label_period_unit=PeriodUnit.day,
    label_period_val=30,
    auto_feature_hops_back=3,
    auto_feature_hops_front=0,
)

gr.add_node(cust_node)
gr.add_node(orders_node)
gr.add_node(notifications_node)

gr.add_entity_edge(
    parent_node=cust_node,
    relation_node=orders_node,
    parent_key="id",
    relation_key="customer_id",
    relation_type="parent_child",
    reduce=True,
)

gr.add_entity_edge(
    parent_node=cust_node,
    relation_node=notifications_node,
    parent_key="id",
    relation_key="customer_id",
    relation_type="parent_child",
    reduce=True,
)

gr.do_transformations()

print("rows:", len(gr.parent_node.df))
print("columns:", len(gr.parent_node.df.columns))
print(gr.parent_node.df.shape)
What To Expect
- The final dataframe is materialized on
gr.parent_node.df. - With this sample dataset, you should see
4rows (one per customer incust.csv). - Output columns include original parent columns plus generated feature/label columns.
Run Interactive
This example can also run through the local interactive runner and stream logs in the docs UI. It uses the pandas backend, so no optional backend extras are required.
pip install graphreduce
pip install -r docs/api/requirements.txt
python docs/api/modal_stream_server.py
mkdocs serve
The interactive API runs python examples/hello_world_local_runner.py on the
server host and streams stdout to the browser terminal.
Sample Data Files Used
tests/data/cust_data/cust.csvtests/data/cust_data/orders.csvtests/data/cust_data/notifications.csv